 Try ShortPoint now
In some cases, when you are facing issues using ShortPoint, it will be very helpful to our support team if you provide the output file of the browser console on the page where the issue appears.
The steps to get the console logs are pretty similar among most popular browsers, but there might be slight differences. In this article, you will learn how to obtain them in different browsers.
Please, check the steps below.
Note: Please collect the console file on the page where the issue is happening, after the page is fully loaded.
TABLE OF CONTENTS
- Google Chrome
- Firefox
- Internet Explorer
- Microsoft Edge
- Safari
- Opera
- Send the saved file to our Support Team
Google Chrome
Step 1: Open the Developer tools
Press F12 or right-click your mouse at any part of the page and select Inspect from the drop-down options:

Step 2: Switch to the Console tab
Once you open the Developer tools, the Elements tab will be active. Switch to the Console tab:

Step 3: Save the logs
Option 1:
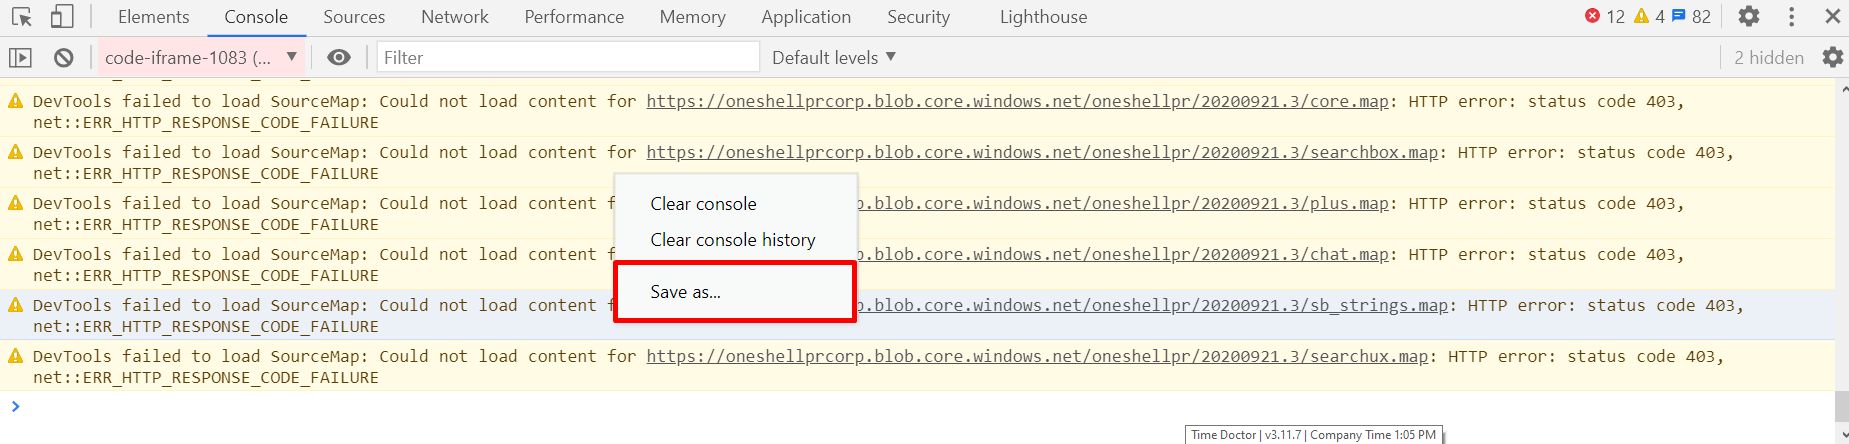
Right-click at any place in the console content, and choose "Save as...", as shown below:

Save the file.
Option 2:
If you do not see any data in the saved file, just copy and paste the console logs to any text editor (for example, Notepad) and save it as a text file.
Firefox
Step 1: Open Web Developer tools
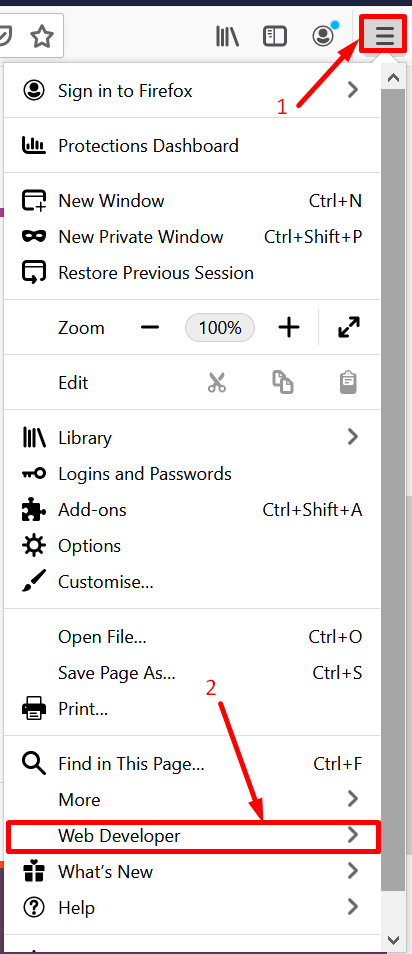
Click hamburger menu button (1) and select Web Developer option from the drop-down (2):
Step 2: Open Web Console
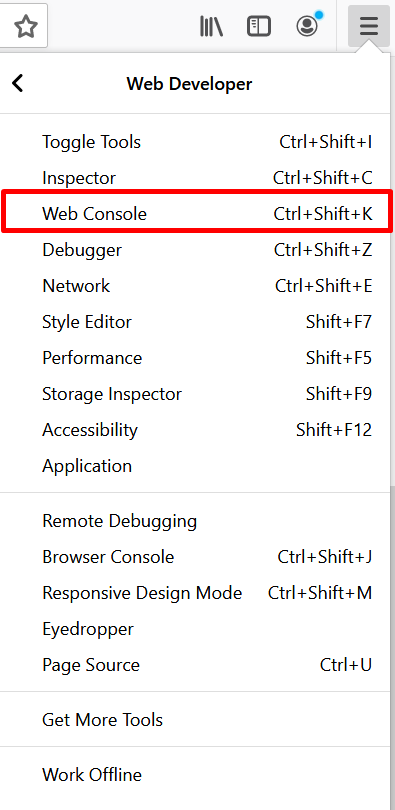
Choose Web Console from the options:
You will see the Console tab opened:

Step 3: Save the logs
Select the console log text, copy and paste it to any text editor (for example, Notepad), and save it as a text file.
Internet Explorer
Step 1: Open the Developer tools
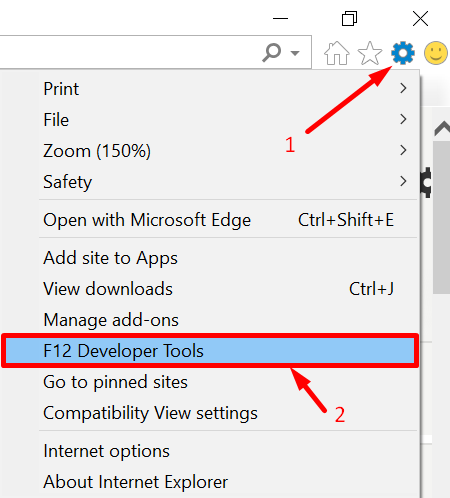
Press F12, or click the cogwheel icon in the top right corner to open Tools (1) and select F12 Developer Tools option from the drop-down (2):
Step 2: Switch to the Console tab
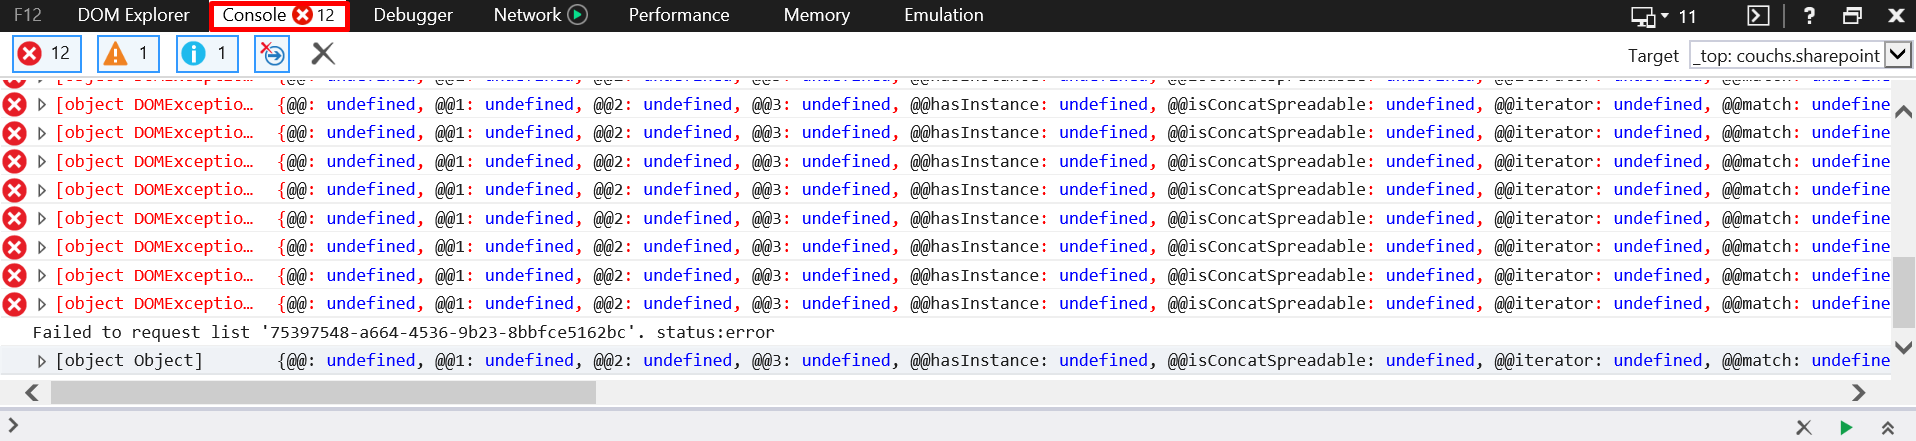
Once you open the Developer tools, DOM Explorer tab will be active. Switch to the Console tab:
Step 3: Save the logs
Right-click at any place in the console content, and choose "Copy all", as shown below:

Paste the copied content to any text editor (for example, Notepad) and save it as a text file.
Microsoft Edge
Step 1: Open the Developer tools
Press F12, or in the top right corner of the page click the ellipsis button to open the settings (1), choose the More tools option (2), and then select Developer tools (3):

Step 2: Switch to the Console tab
Once you open the Developer tools, the Elements tab will be active. Switch to the Console tab:

Step 3: Save the logs
Option 1:
Right-click at any place on the console content, and choose "Save as...", as shown below:

Save the file.
Option 2:
If you do not see any data in the saved file, just copy and paste the console logs to any text editor (for example, Notepad) and save it as a text file.
Safari
Prerequisite: Enable Apple Safari Develop menu
By default, the Develop menu in Safari is disabled. To enable it, open the Safari menu and choose the Preferences option.

Switch to the Advanced tab.

Put a checkmark for the Show Develop menu.

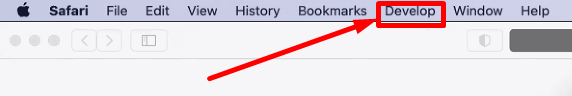
Make sure that you see the Develop menu between the Window menu and the Bookmarks menu.
Close the Preferences.
Step 1: Open the Developer tools
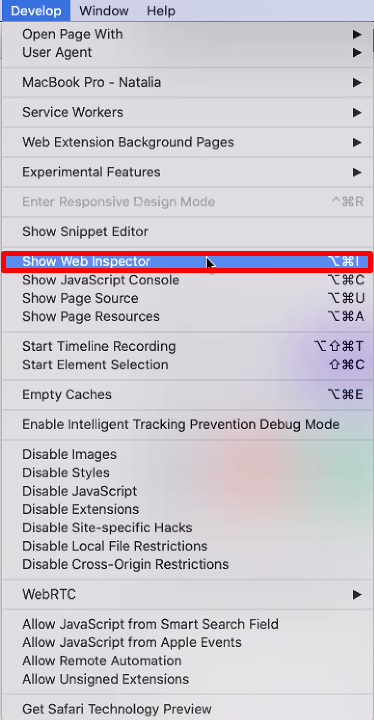
Click the Develop menu (1) and then Show Web Inspector (2).
Step 2: Switch to the Console tab
Once you open the Web Inspector, the Elements tab will be active. Switch to the Console tab:

Step 3: Save the logs
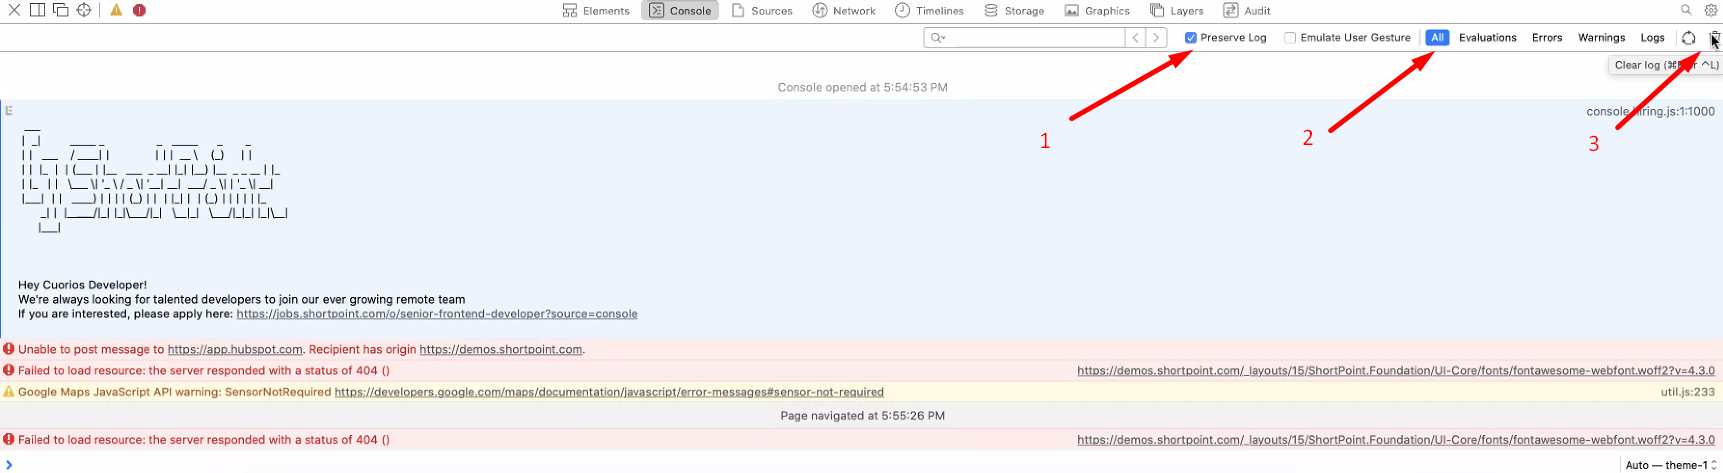
Before saving the logs, put a checkmark for Preserve Log (1), make sure that you have selected filter for All (2) and click the Clear log (3) button, as shown below:
Reproduce the issue you are facing. Now the console activity is recorded.
Select text in the console using Cmd+A hotkey or right-click at any place in the console content, and choose Copy Selected:

Paste it to any text editor (for example, Notepad) and save it as a text file.
Opera
Step 1: Open the Developer tools
Right-click at any place on your page, and choose Inspect element from the options:

Step 2: Switch to the Console tab
Once you open the Developer tools, the Elements tab will be active. Switch to the Console tab:

Step 3: Save the logs
Option 1:
Right-click at any place in the console content, and choose "Save as...", as shown below:
Save the file.
Option 2:
If you do not see any data in the saved file, just copy and paste the console logs to any text editor (for example, Notepad) and save it as a text file.
Send the saved file to our Support Team
Attach the console file to the ticket you are submitting (using the ticket submitting form or via support@shortpoint.com email). Our support team will check it and contact you shortly.

Related article:
