Try ShortPoint now
TL;DR:  Embed Power BI reports and dashboards on SharePoint pages through ShortPoint using a user-based license, either Power BI Pro or Premium Per User. Each site visitor signs in with their own Pro or Premium Per User account to see the content. A session lasts one hour, and visitors without a license can’t see the report.

To set it up, click Edit on the SharePoint page, close the Toolbox, and click the Edit Properties icon. Then click the plus icon, add the Power BI Design Element, click Connect under Option 1, and sign in with your Power BI credentials. Next, choose the workspace, whether to show a report or a dashboard, which one, and (for reports) which page. In the Advanced tab you can set the size ratio (16:9, 4:3 or custom) and the login message. Finally, click the green check mark, then Save and Publish.
In this article, we’ll guide you through integrating Power BI dashboards and reports if you have a user-based license (such as Power BI Pro or Premium Per User).
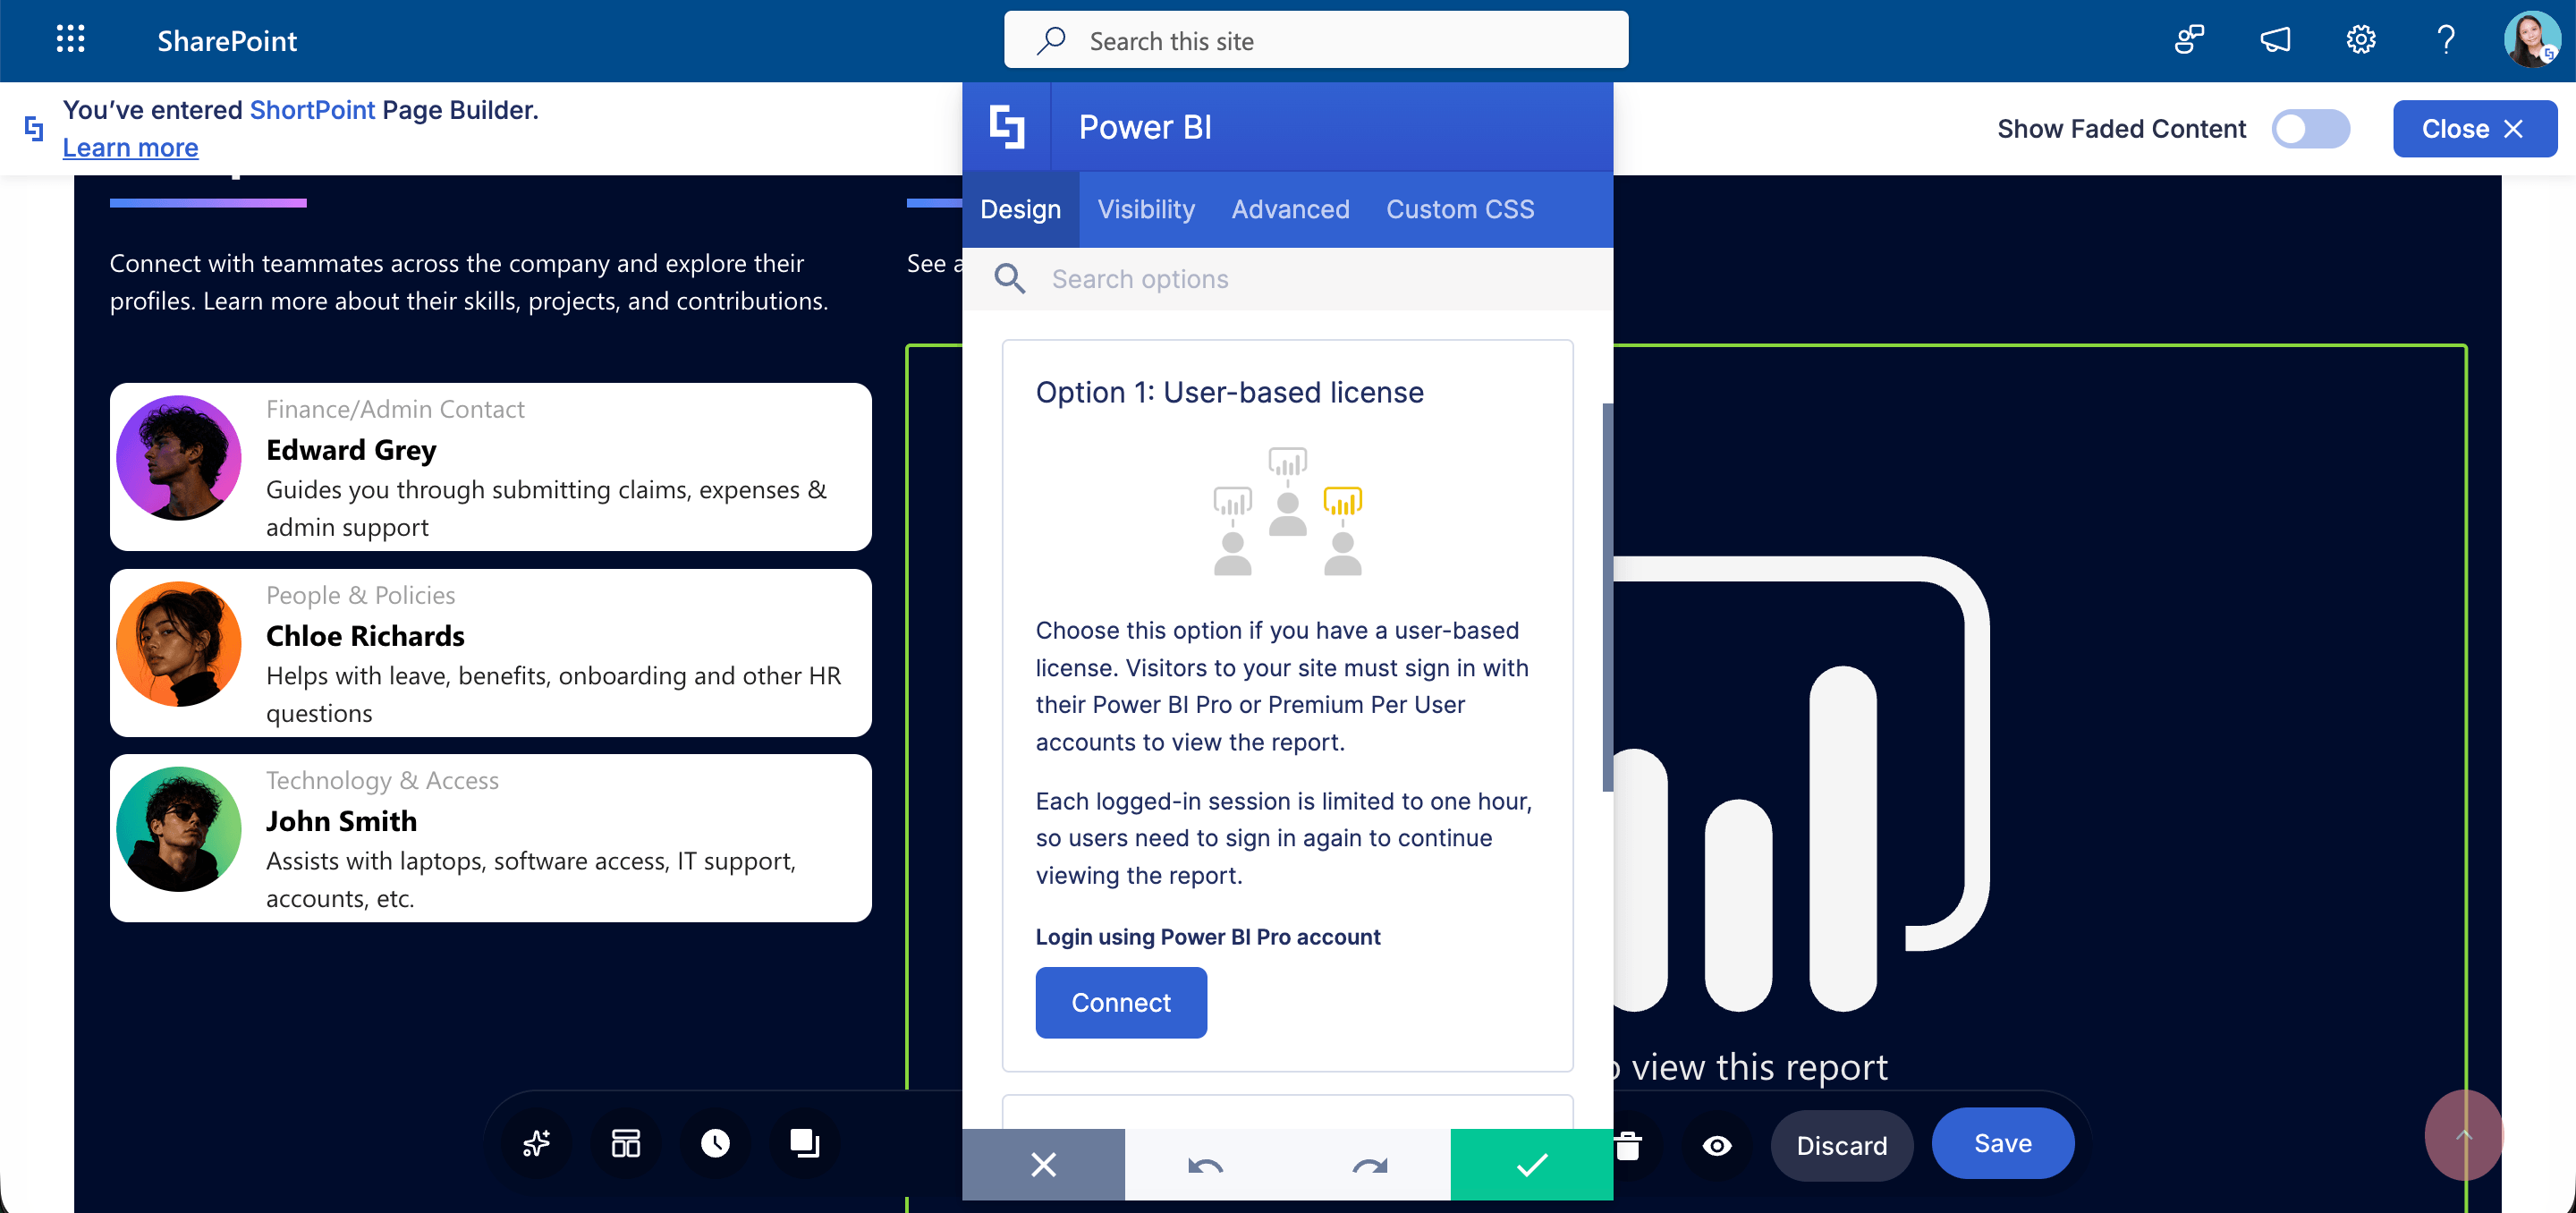
TABLE OF CONTENTS
- Prerequisites
- User-Based License Overview
- Interactive Tutorial
- Power BI Features
- Frequently Asked Questions
- What is the User-based License integration option for Power BI?
- What are the prerequisites for using Power BI integration with a User-based License?
- How long does a Power BI session last for a signed-in user?
- What happens if a site visitor does not have an active Power BI license?
- Can I customize the appearance of the embedded Power BI report?
Prerequisites
- You have the latest ShortPoint SPFx version installed.
- You are a ShortPoint Designer with either a Pro or Enterprise License. For more information, check out Licensing Options.
- You have an active Power BI Pro or Premium Per User license.
- You must have a Power BI Dashboard or Report you want to showcase on your SharePoint page.
- Your site viewers must have the appropriate Power BI licenses and/or permissions.
User-Based License Overview
The User-based license is one of two options you can use to bring Power BI content into ShortPoint. Choose this route if you hold a Power BI Pro or Premium Per User license and want to share reports with teammates who have the same access level.
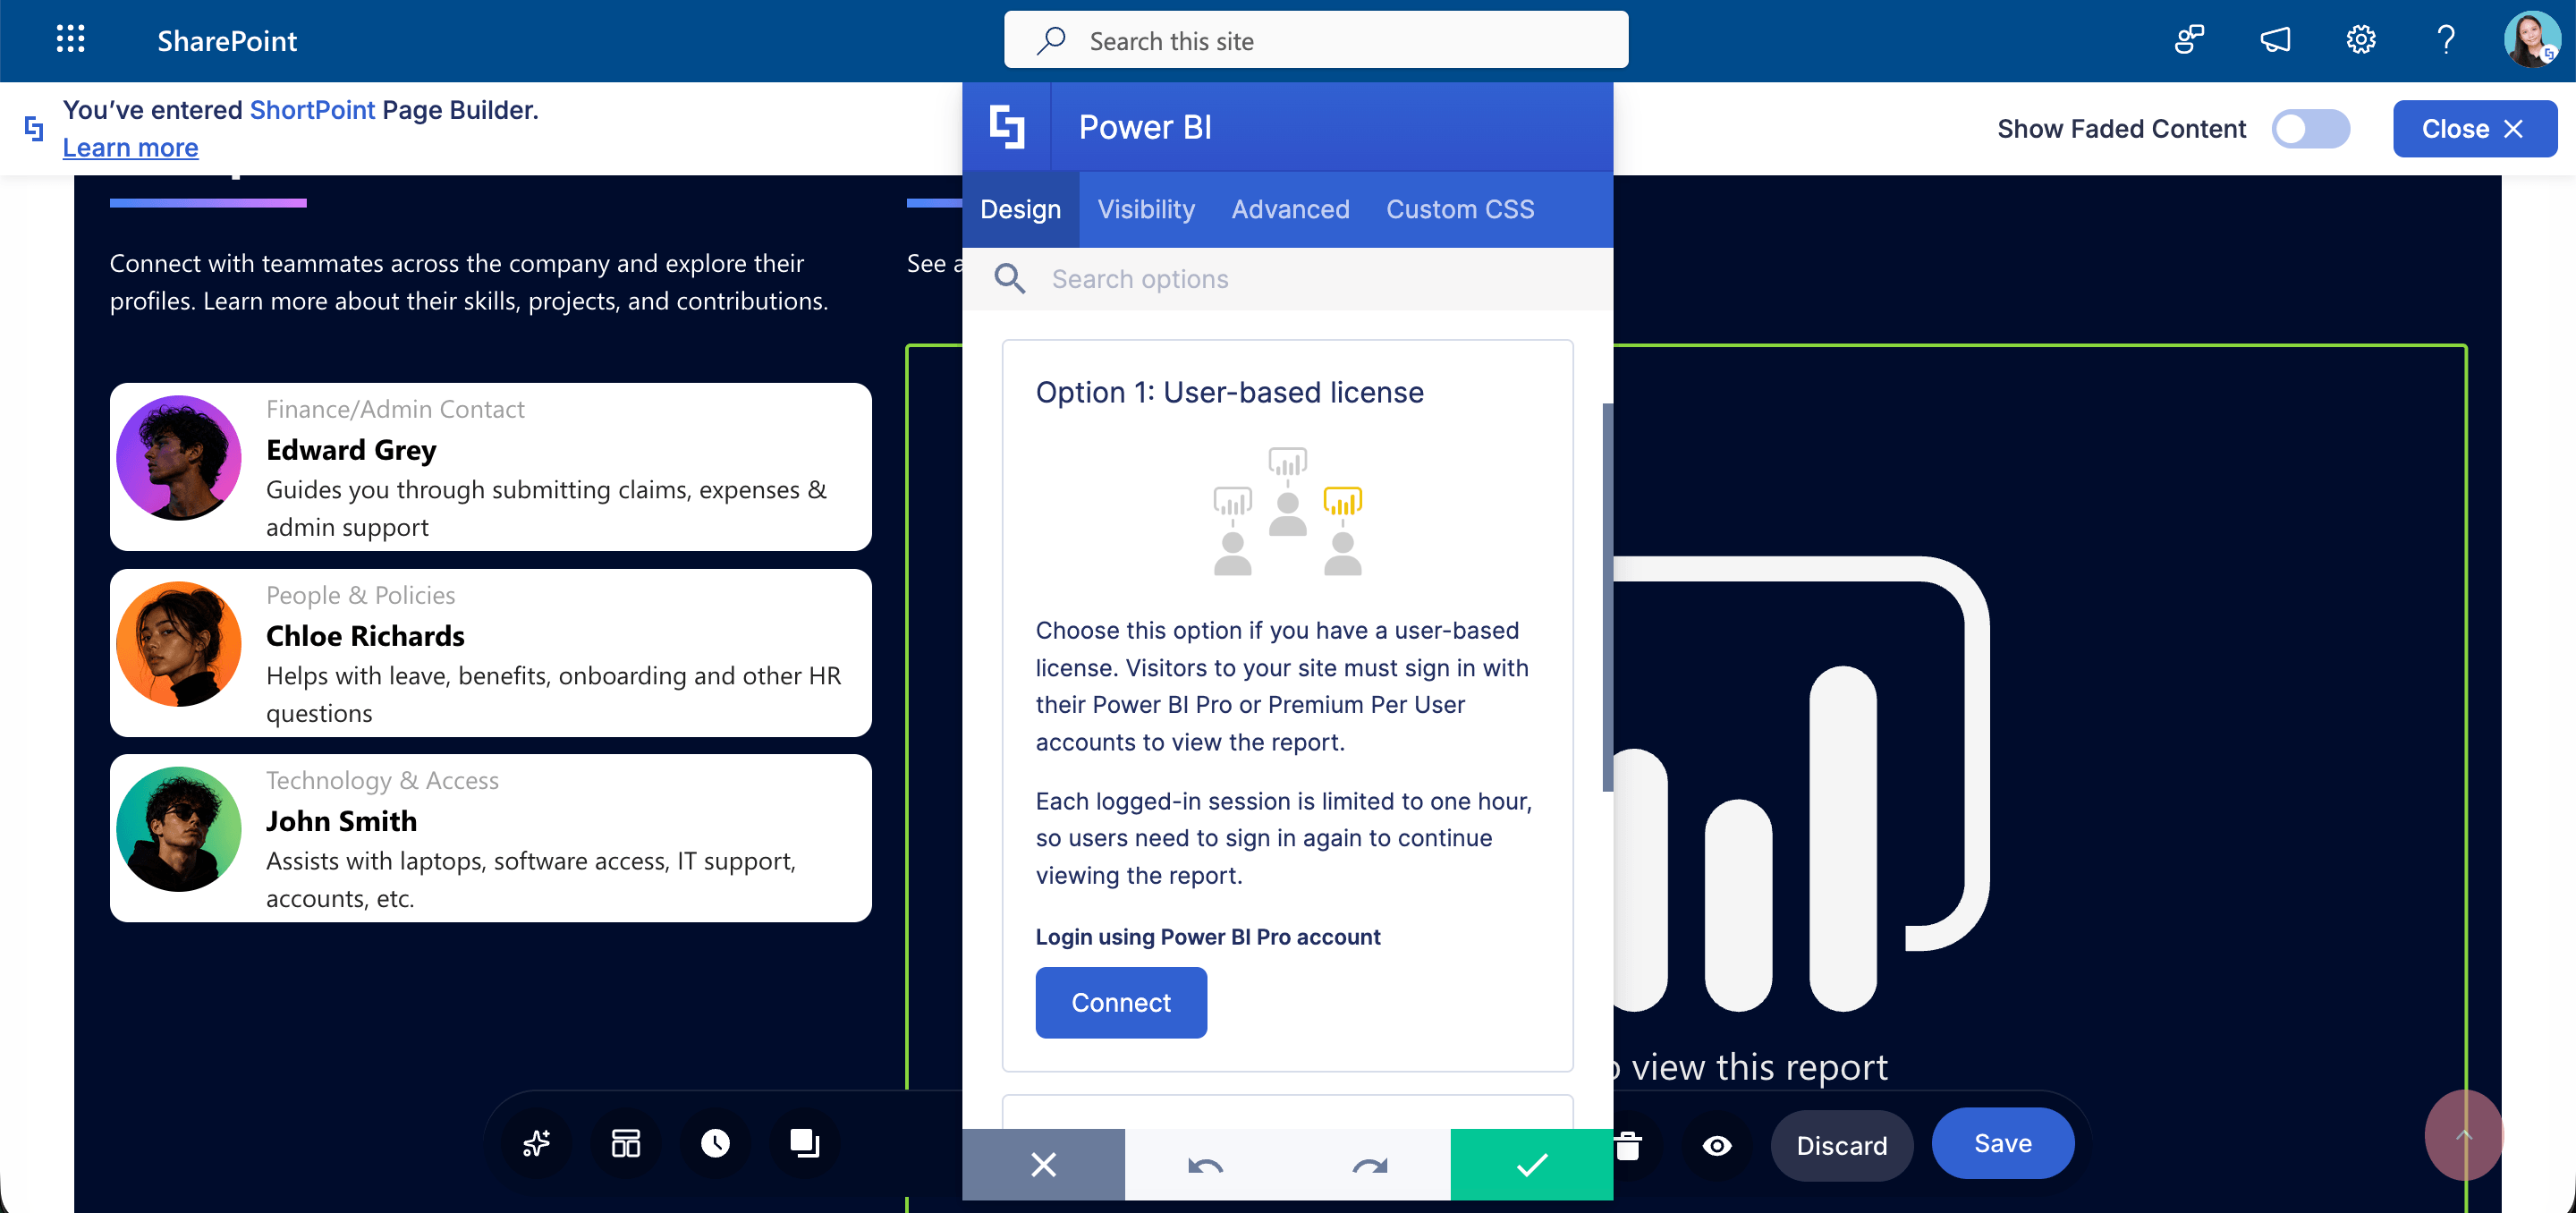
When this option is selected, site visitors will need to sign in with their own Power BI Pro or Premium Per User account to view the content. They will see this notification upon visiting the page:
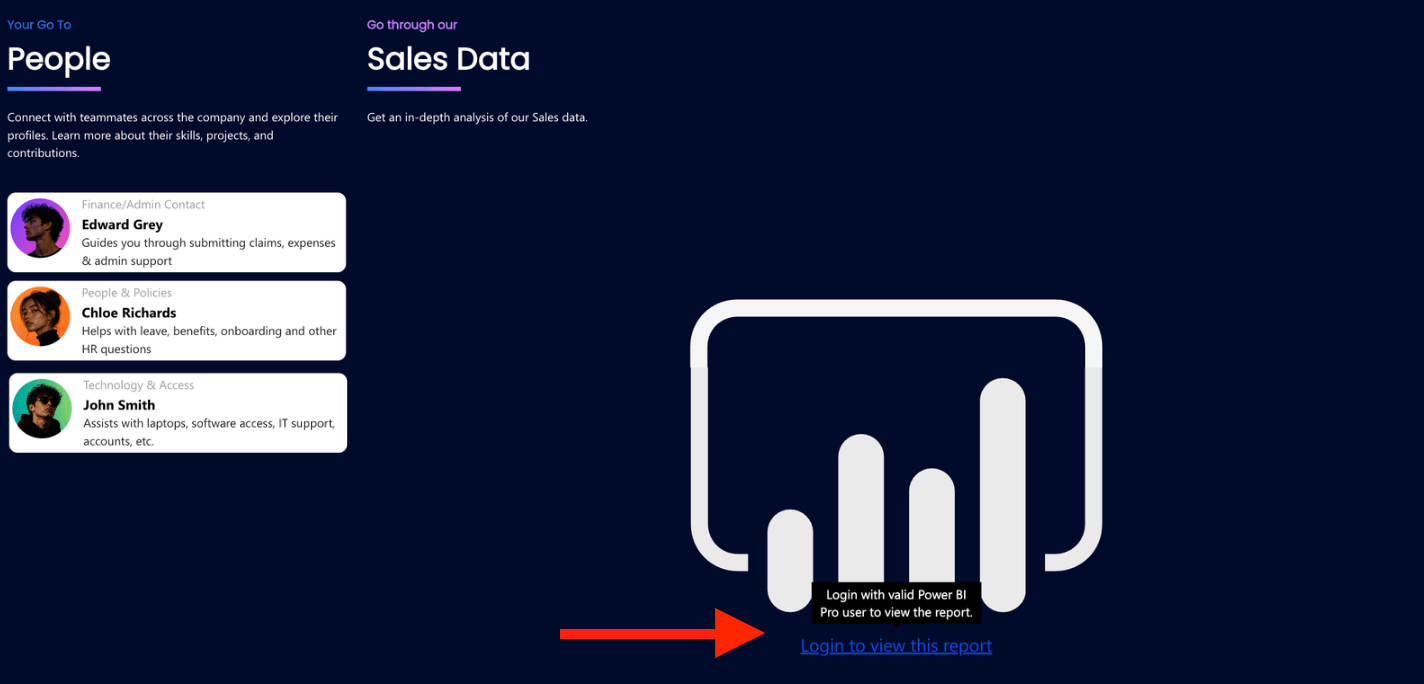
Once logged in, active sessions last for one hour. After 60 minutes, users will simply need to re-enter their credentials to keep viewing the report.
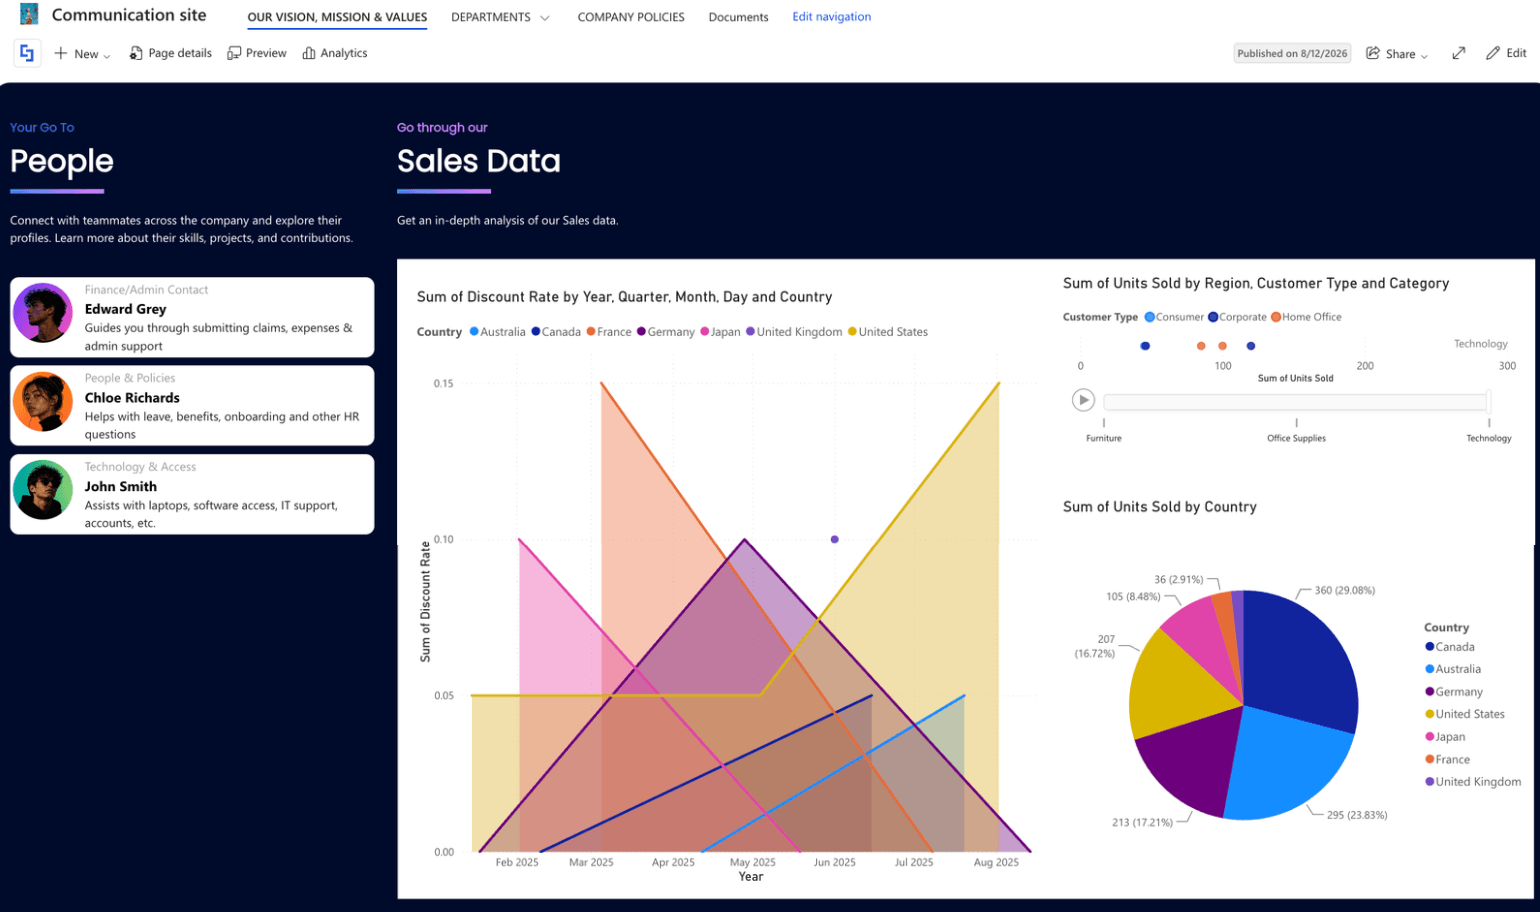
Visitors without an active license, on the other hand, won't be able to see the Power BI report on your SharePoint page.
NOTEIf you or your organization has a Power BI Embedded license, please check out our support article on Power BI Integration Option 2: Capacity-based License Integration instead.
Interactive Tutorial
Start the interactive tutorial to learn how to showcase Power BI reports or dashboards:
Step 1: Edit the ShortPoint web part
- Click the Edit button on the SharePoint page where you want to insert your Power BI report.

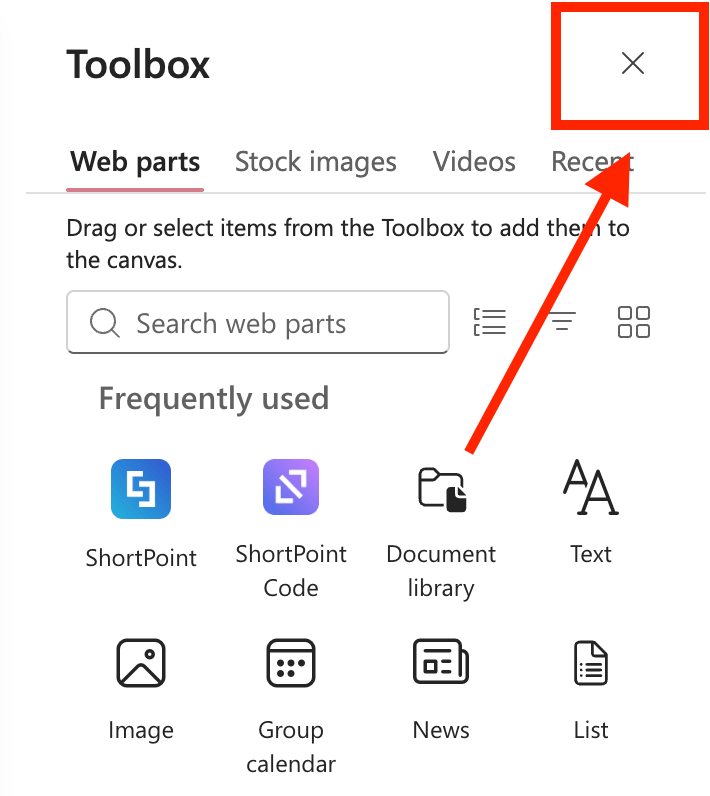
- Close the Toolbox:
- Click the Edit Properties icon:

Step 2: Insert Power BI Design Element
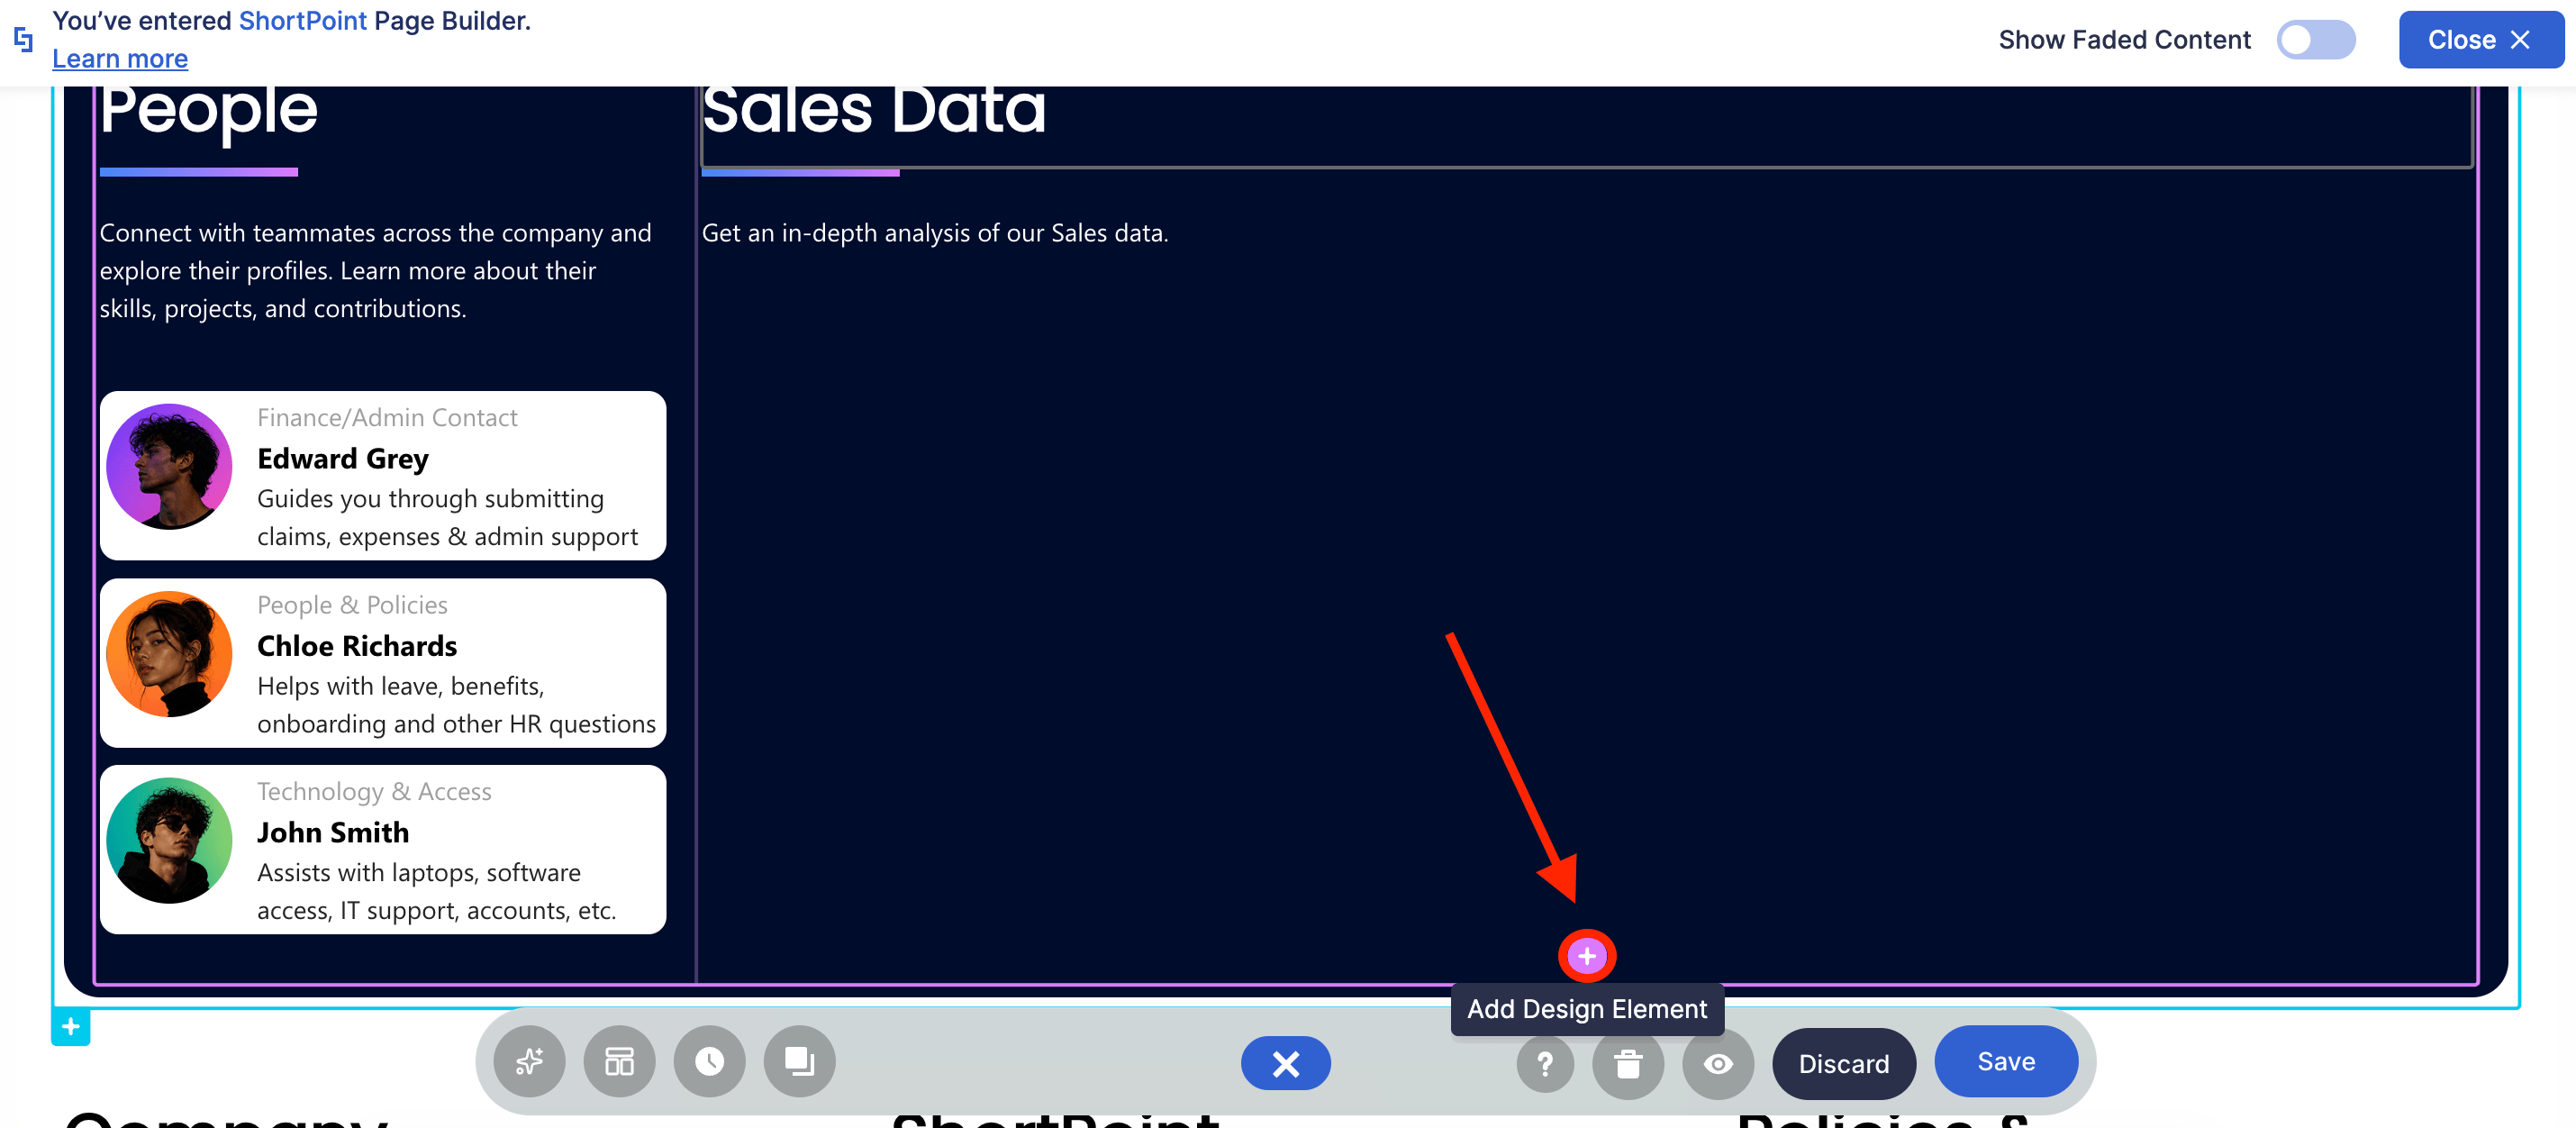
- Navigate to the space where you want to add your Power BI report and click the plus icon.
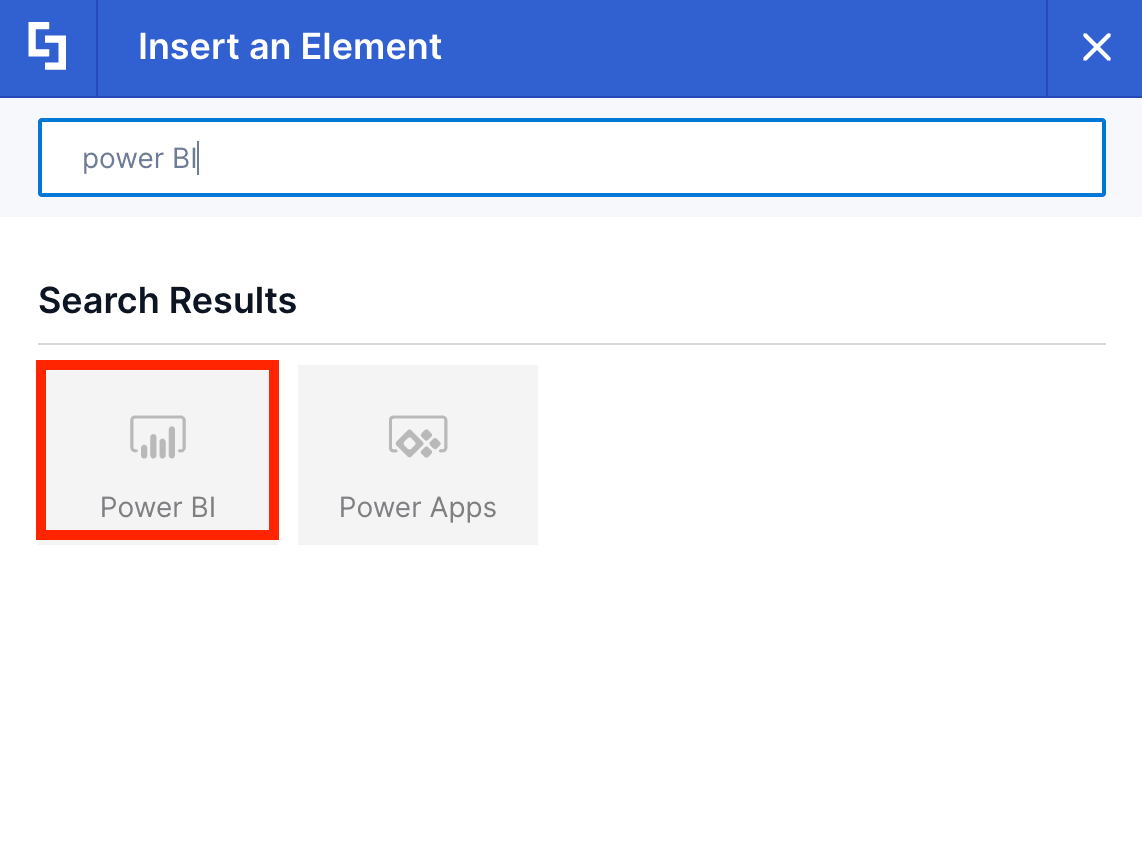
- Scroll down or search for Power BI and select it:
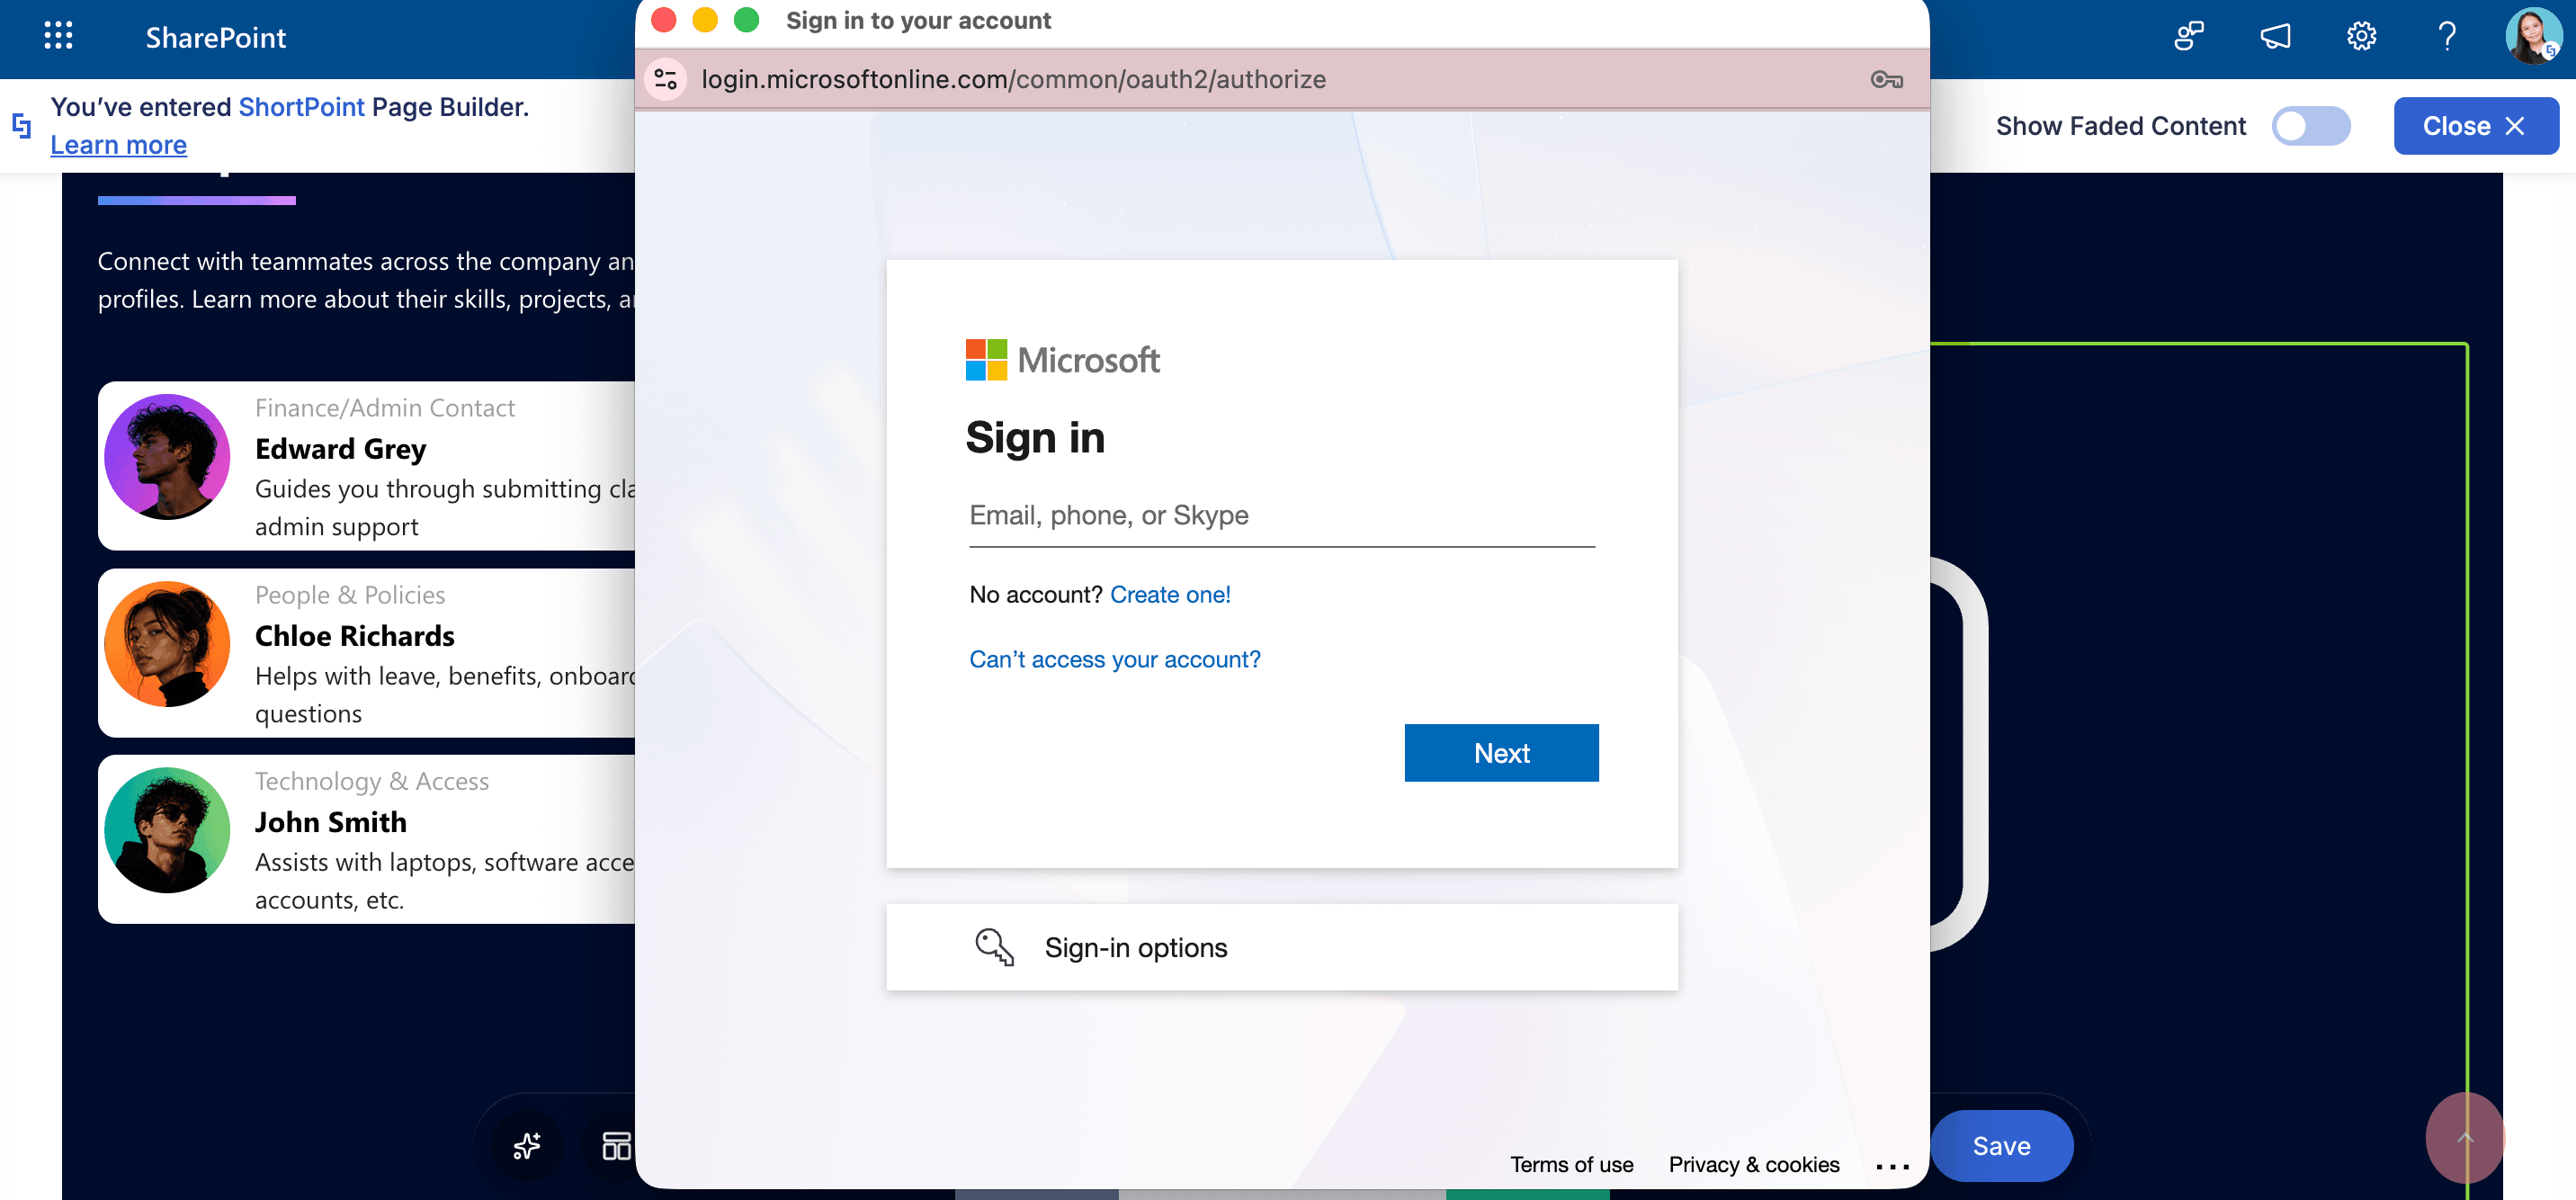
Step 3: Enter Power BI credentials
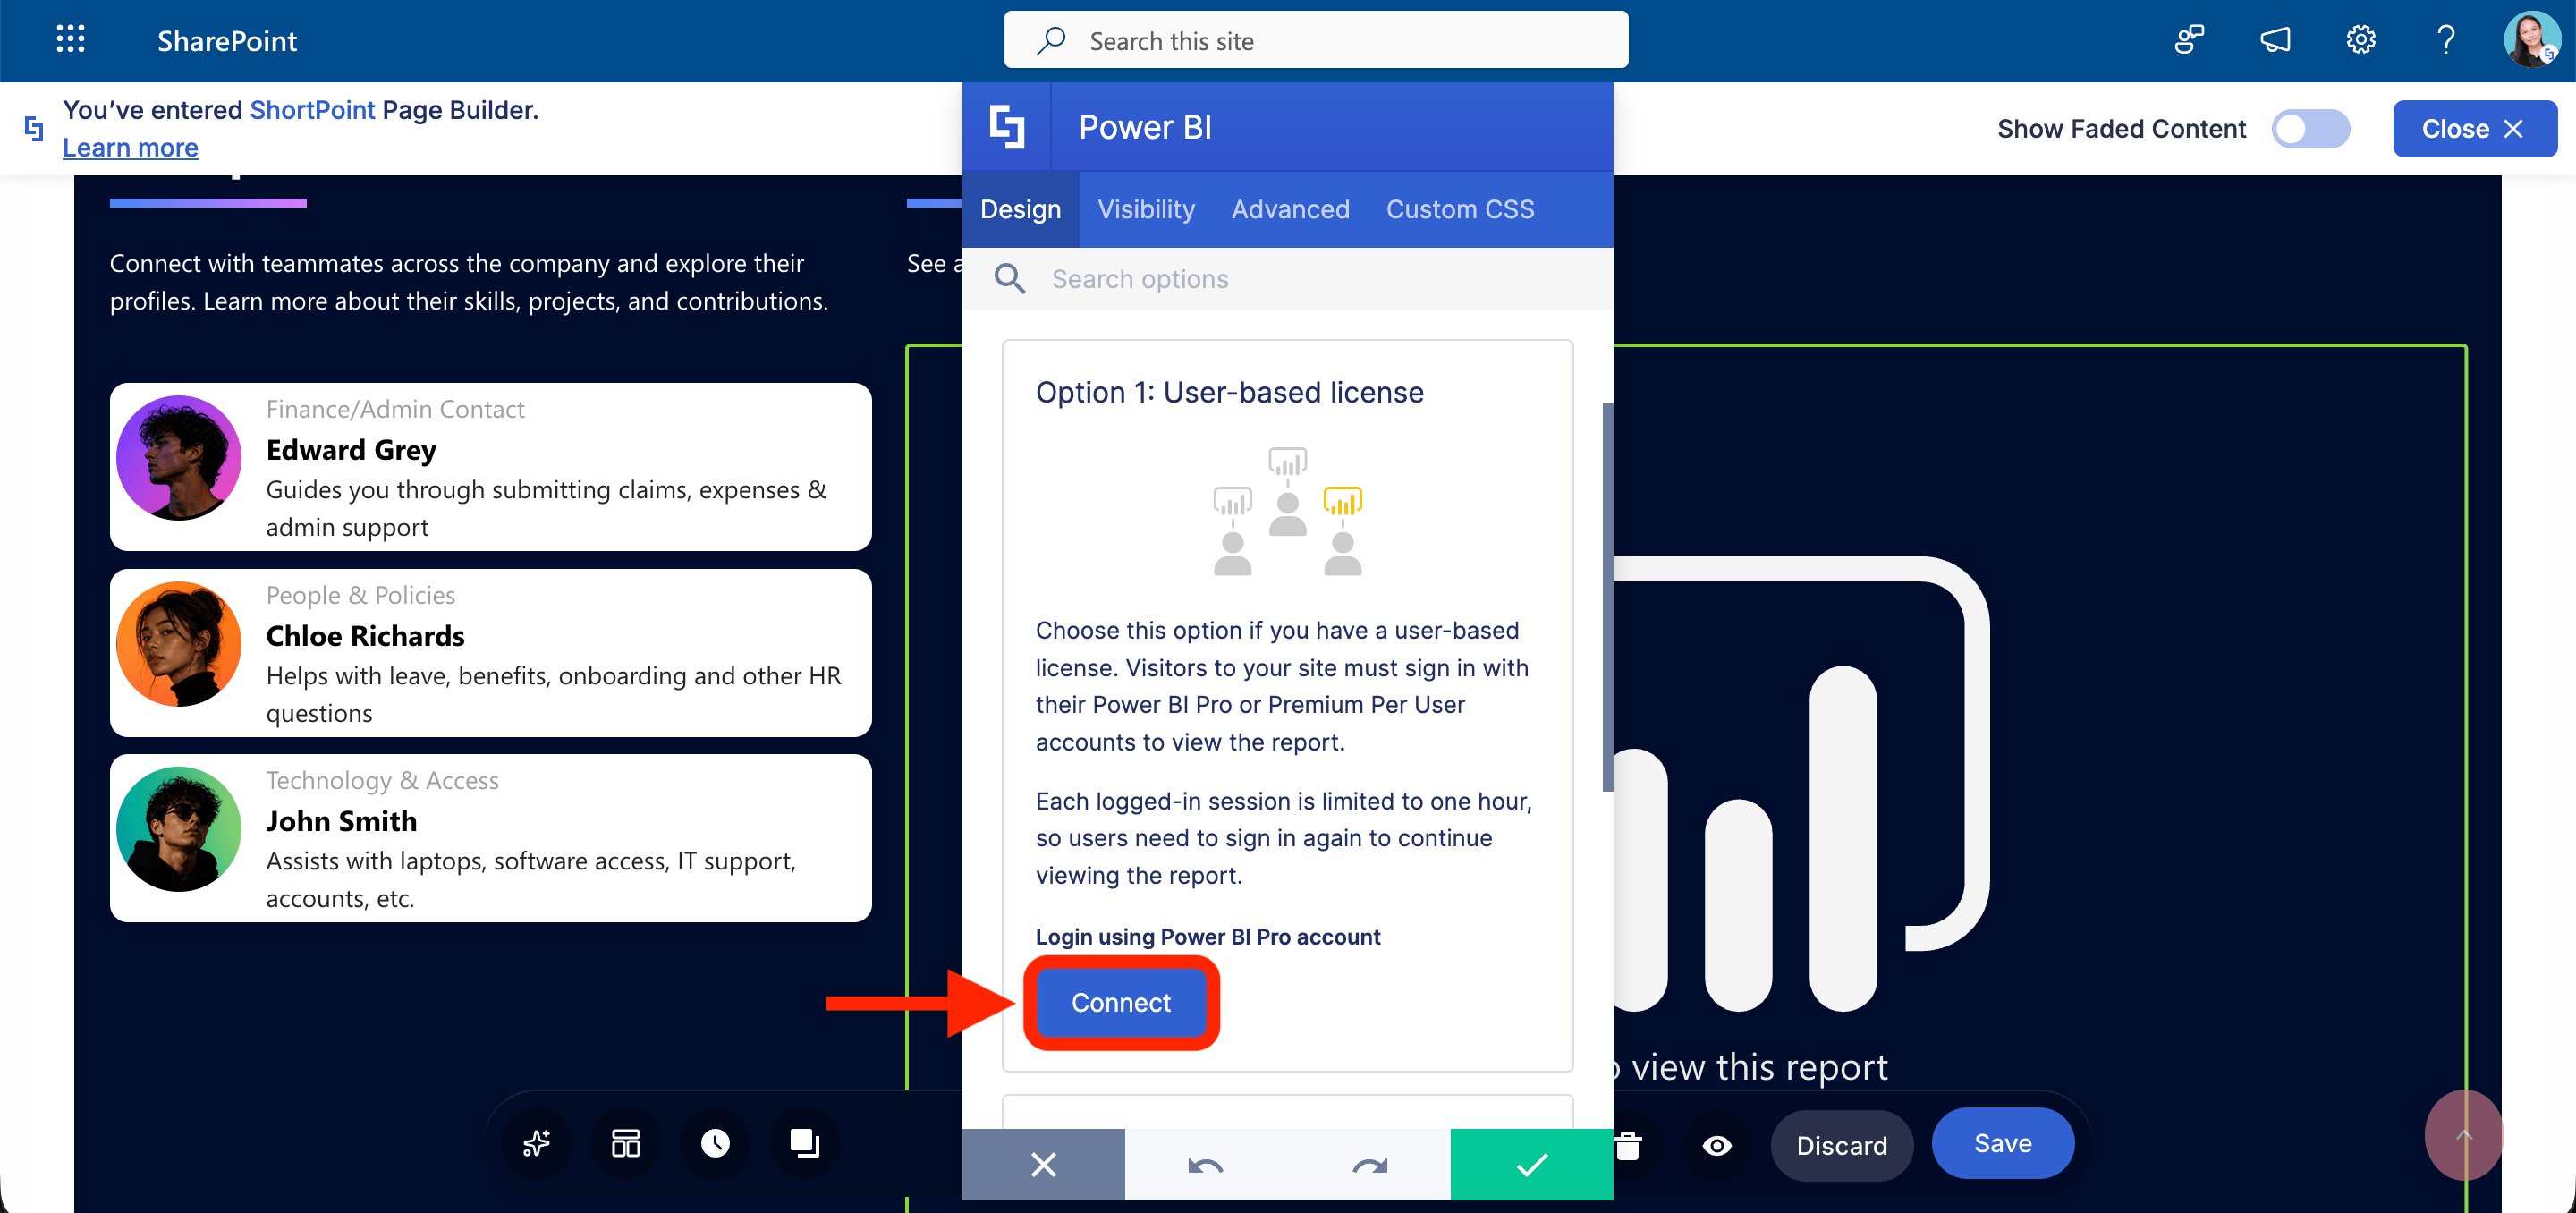
- Under Option 1: User-based License, hit Connect:
- Enter your Power BI Pro or Premium Per User credentials.
NOTEThe login details are cached for up to 60 minutes. You need to sign in again with the same credentials (or with a user having equivalent rights on the selected report) if you want to make further changes.
Step 4: Select the Power BI asset you want to insert
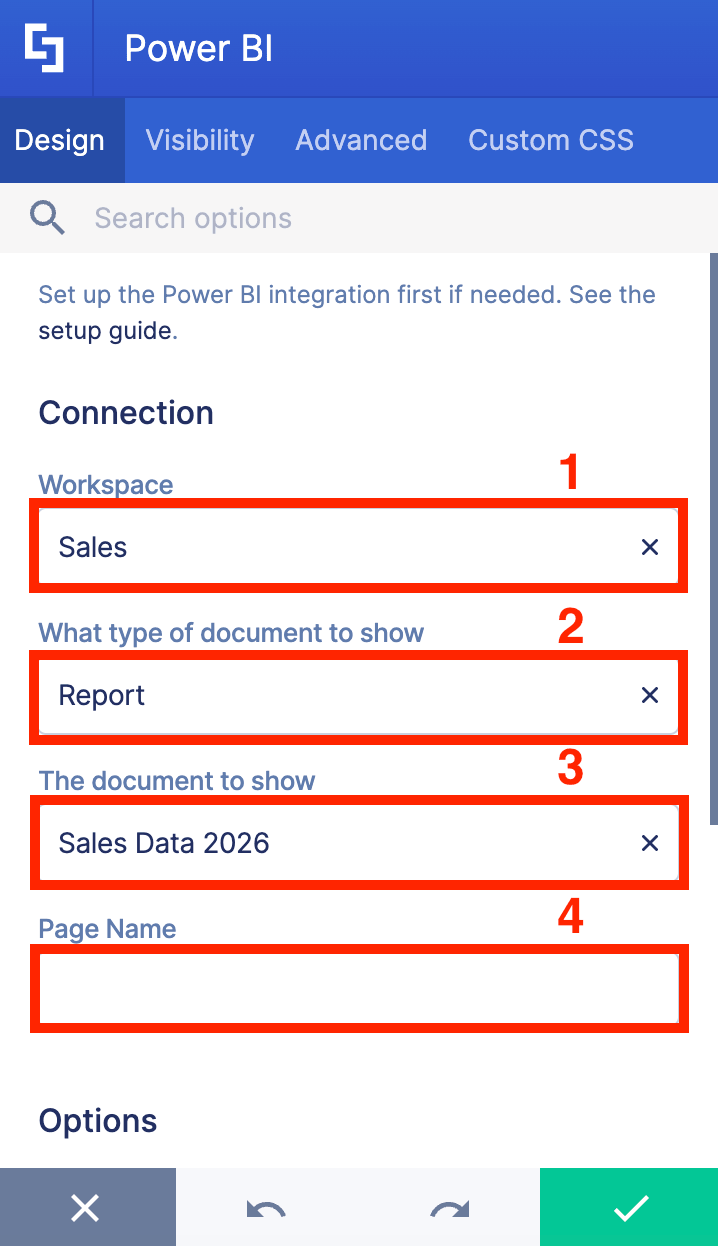
Once authentication is successful, you will be asked to fill out fields that will identify the asset you want to embed into your SharePoint page:
- Workspace - choose the name of the workspace where the Power BI asset is located.
- What type of document to show - choose the type of Power BI asset you have. You can choose from Report or Dashboard.
- The document to show - choose the name of the report or dashboard to showcase.
- Page Name - this field is only available when you select ‘Report’ under the document to show field. This will allow you to select the page you want to display.
Step 5: Customize the Look of the Power BI Report
- Go to the Advanced tab:

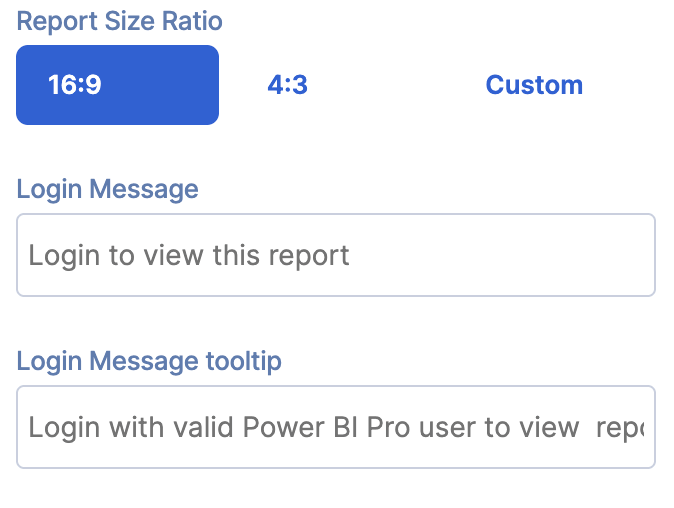
- Customize the login prompt and size of the Power BI report/dashboard:
NOTETo see all the customization options available, check out Power BI Features.
Step 6: Insert and save
- Click the green check mark:

- Click Save to apply your changes:

- Publish the page:

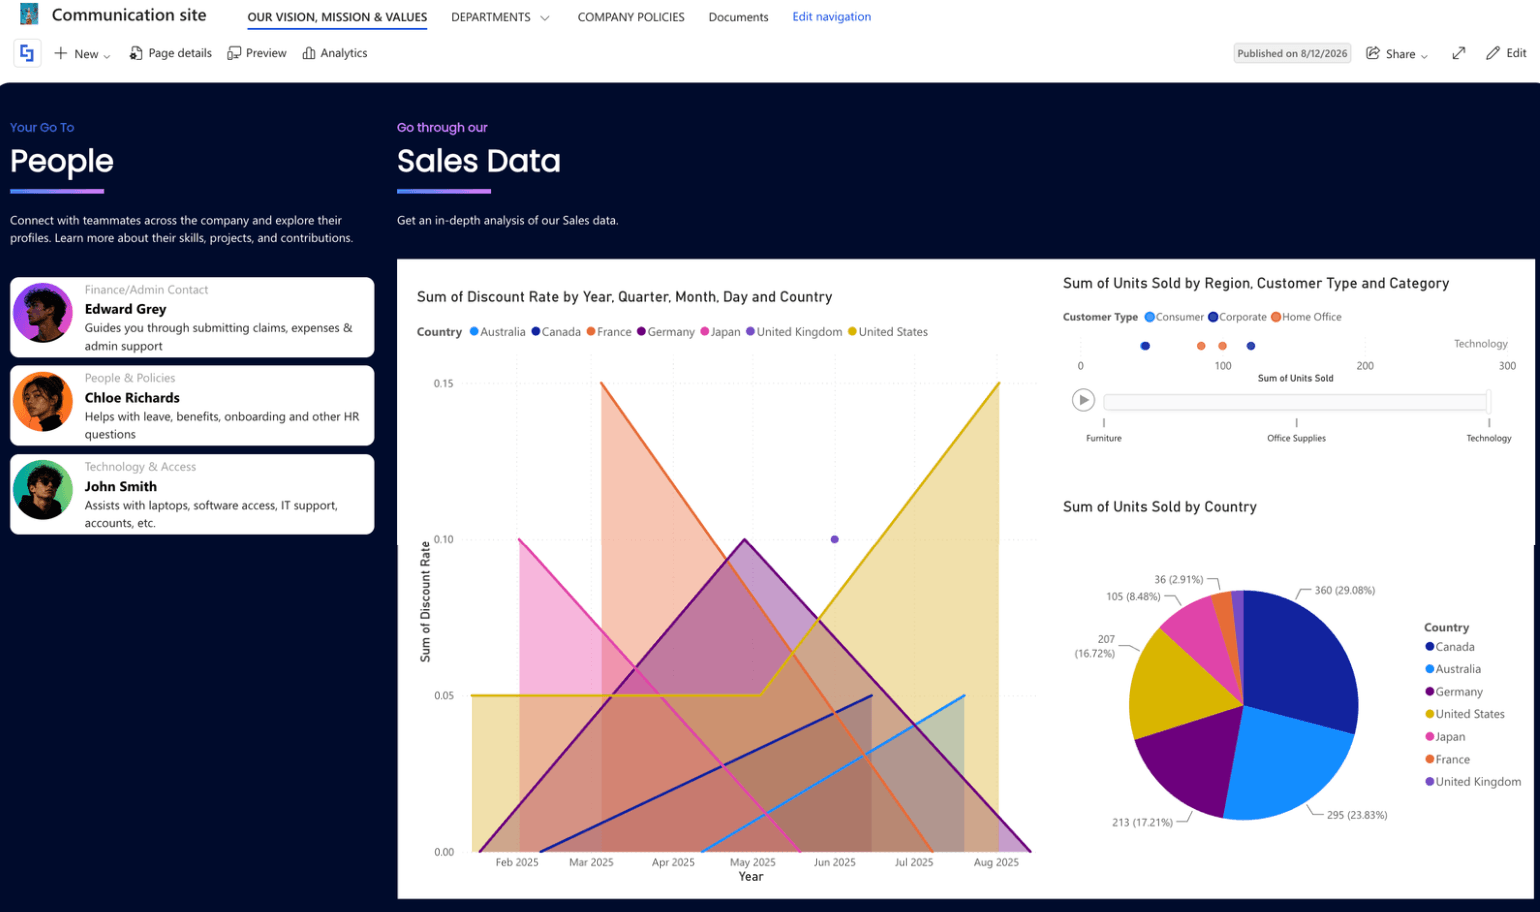
That's it! You now know how to embed a Power BI asset to your SharePoint page.
Power BI Features
Here are the settings you can find inside the Settings window of Power BI:
A. Design Tab
The Design tab is where you can edit the content inside the Power BI Design Element. Here are the options you can tweak:
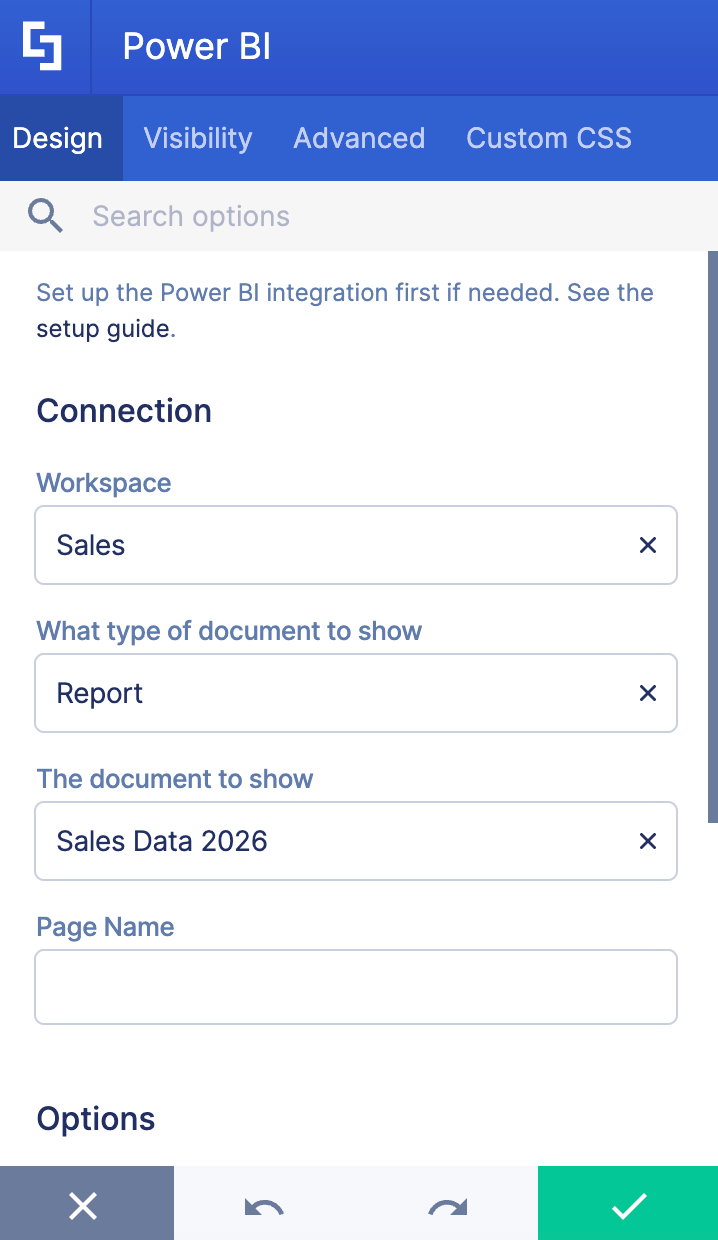
CONNECTION
 | Workspace | allows you to choose the specific workspace where the report or dashboard you want to showcase is located. |
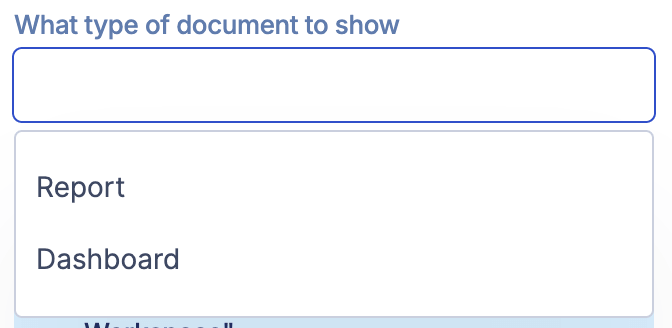 | What type of document to show | allows you to choose whether you’ll showcase a dashboard or a report. |
 | The document to show | allows you to choose the name of the dashboard/report that will be shown. |
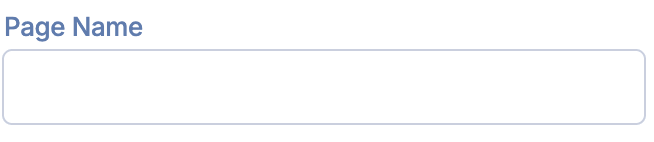 | Page Name | this field is only available when you select ‘Report’. This will allow you to choose the page to show. |
OPTIONS
NOTEThese fields are only available if you are showcasing Power BI Reports.
 | Show Filter Panel | when enabled, the filters panel will be shown on the page, together with the dashboard/report. |
 | Allow Page Navigation | when enabled, site viewers can navigate to different report pages. |
B. Visibility Tab
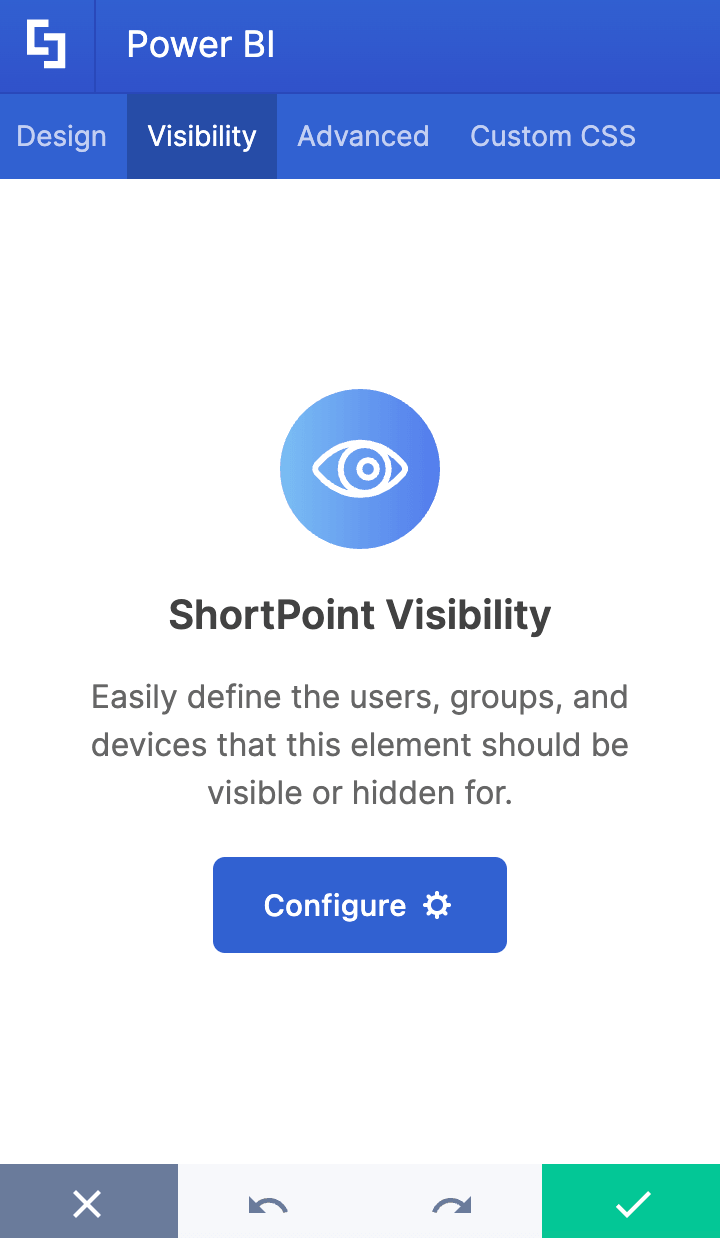
The Visibility tab allows you to specify who can see the Design Element and what type of devices it can be shown on. For more details, check out How to Use the ShortPoint Visibility Feature for Effective SharePoint Access Management.
C. Advanced Tab
The Advanced tab allows you to customize the look of the Power BI report even further, including the message that pops up when a user needs to log in. These are the options available:
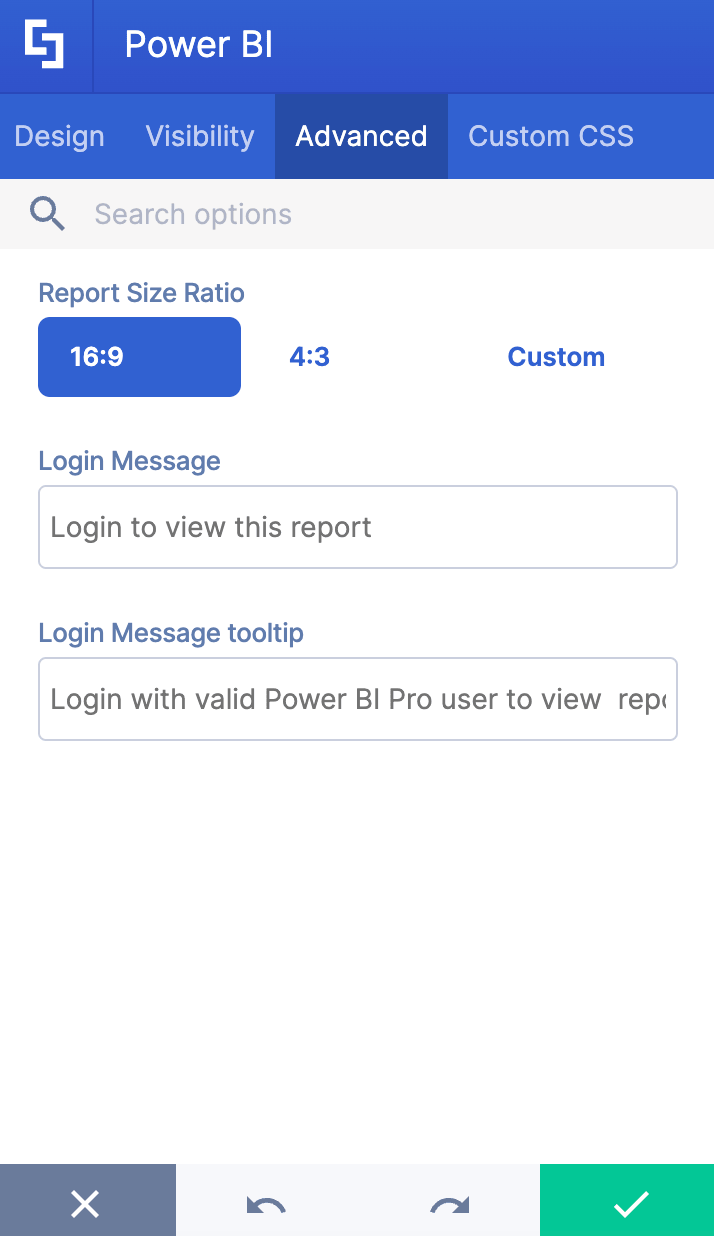
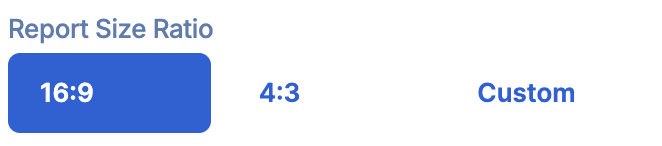 | Report Size Ratio | by default, reports and dashboards will use the full width of the column where they are added. However, if resizing is necessary, you have the following options:
|
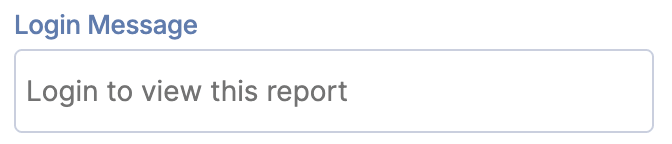 | Login Message | allows you to customize the text that appears when you prompt site viewers to log in and view the report. |
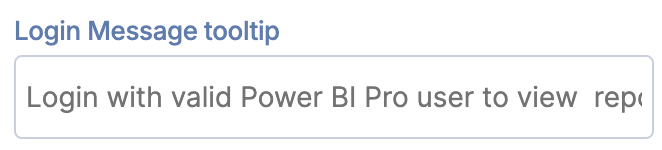 | Login Message Tooltip | allows you to modify the tooltip text that will appear on hover. |
D. Custom CSS Tab
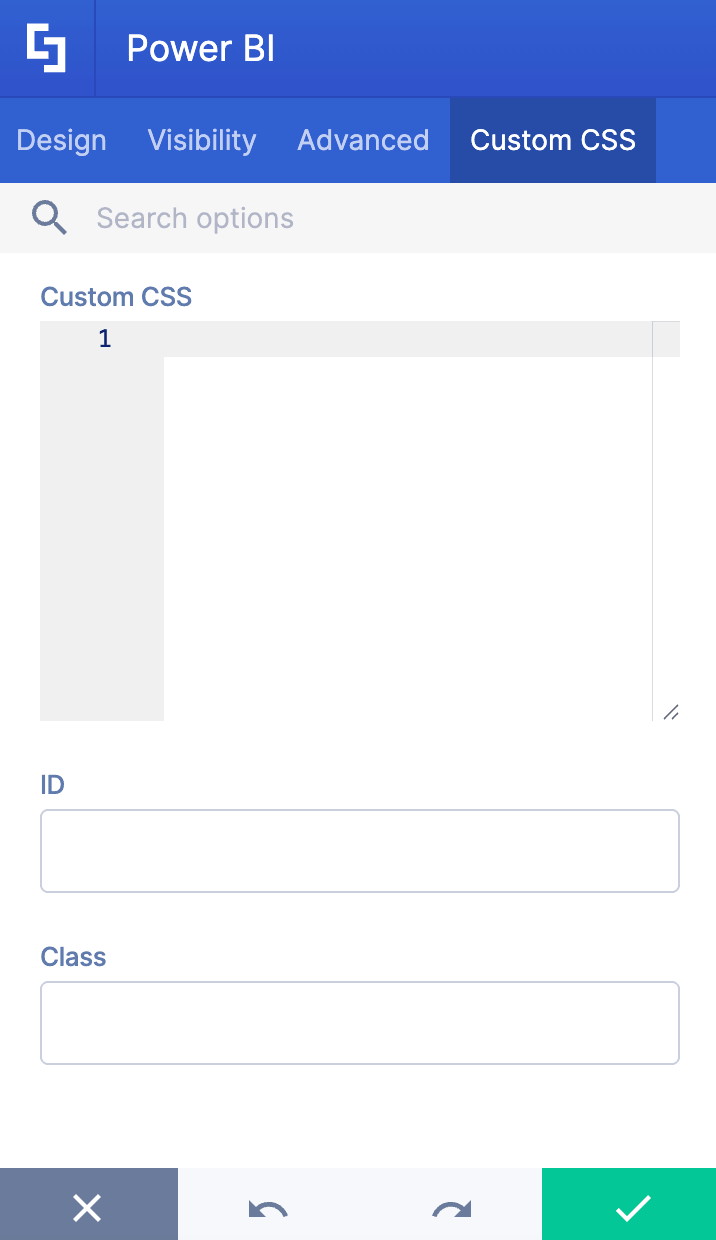
This tab lets you add your own custom touch to the Power BI Design Element using custom CSS. This gives site owners and designers greater control over how it will look on your page.
NOTECheck out our support article on How to Insert Custom CSS into a Page Builder Element? (Basic Tutorial) to know more about Custom CSS.
Frequently Asked Questions
What is the User-based License integration option for Power BI?
The User-based License integration option allows you to embed Power BI dashboards and reports into SharePoint pages if you have a Power BI Pro or Premium Per User license. Site visitors need to sign in with their own Power BI credentials to view the content.
What are the prerequisites for using Power BI integration with a User-based License?
You need the latest ShortPoint SPFx version installed, an active ShortPoint license (Pro or Enterprise), an active Power BI Pro or Premium Per User license, a Power BI dashboard or report to showcase, and appropriate licenses or permissions for site viewers.
How long does a Power BI session last for a signed-in user?
Once logged in, active sessions last for one hour. After 60 minutes, users need to re-enter their credentials to continue viewing the report.
What happens if a site visitor does not have an active Power BI license?
Visitors without an active license will not be able to see the Power BI report on your SharePoint page.
Can I customize the appearance of the embedded Power BI report?
Yes, you can customize the login prompt, size ratio (16:9, 4:3, or custom size), filter panel visibility, and enable page navigation through the Advanced and Design tabs.
Related articles: